Verification of Data
Using the data table (Table 1), verification was carried out prior to detailed statistics using graphical techniques such as histogram and box plots. Both dependent variable indicated a normally distribiuted data but relationship between variables were not considerable due to value(scale) diference. But tranformations of plot volume index which was calculated not measured may show correlations between the variables. Absence of outliers in the box-whisker plot indicates that values are not widely spread away from the quartiles and the raw dataset needing no transformations.
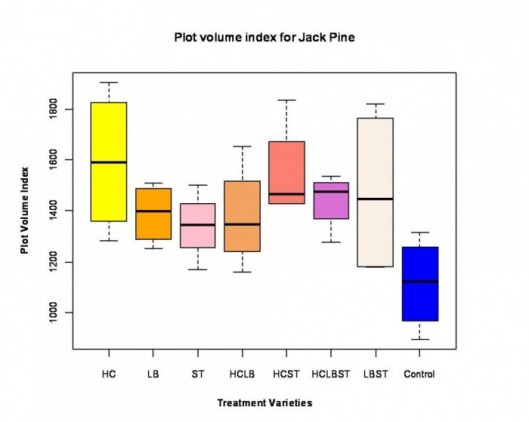
Figure 1. Boxplot comparing plot index volume index between treatments. Median values are indicated by solid black bars, while the whiskers shows the minimum and maximum values for each treatment.
HC=Hebeloma, LB= Laccaria,ST=Suillus, HCLB=Hebeloma+Laccaria,HCST=Hebeloma+Suillus, HCLBST=Hebeloma+Laccaria+Suillus, LBST=Laccaria+Suillus. This applies to Figure 2 and 3 below.
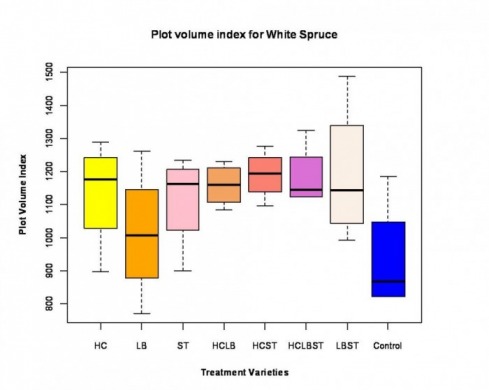
Figure 2. Boxplot comparing plot index volume index between treatments. Median values are indicated by solid black bars, while the whiskers shows the minimum and maximum values for each treatment.
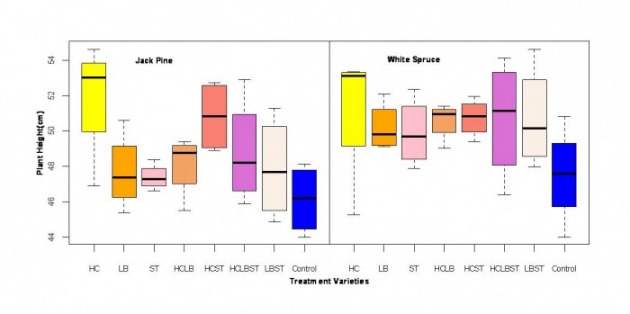
Figure 3. Boxplot comparing plant heights between treatments and species. Median values are indicated by solid black bars, while the whiskers shows the minimum and maximum values for each treatment.
Preliminary conclusion
From the data verification, the boxplots indicated a fair spread of all data set with no outliers. However, each treatment either singly or mixed were skewed or symmetrical for plot volume index and plant height. The control for the two plant species(plant height) were symmetrical with a skewed data observed in PVI for White spruce. The preliminary conclusion is that the position of the control against the singly inoculated treatments may prove the study hypothesis to be true. This will be confirmed in detailed statistics with pairwise comparisons between treatments.
From the data verification, the boxplots indicated a fair spread of all data set with no outliers. However, each treatment either singly or mixed were skewed or symmetrical for plot volume index and plant height. The control for the two plant species(plant height) were symmetrical with a skewed data observed in PVI for White spruce. The preliminary conclusion is that the position of the control against the singly inoculated treatments may prove the study hypothesis to be true. This will be confirmed in detailed statistics with pairwise comparisons between treatments.
Disclaimer: This is a class exercise based on random and modified dataset
