Prior to statistical analysis, data was checked for violation of assumptions such as normality of distribution and homogeneity of variances. The normality test was determined by visual representation of histogram and the Shapiro-Wilk test using residual values, while homogeneity of variances was determined using Bartlett test-plot of residuals. P values above 0.05 were considered normal and having homogenous variances. All response variables met normality and homogeneity (Figure 1 & Figure 2) assumptions as they had p values higher than 0.05 and residuals had even spread of points.
Statistical analysis was performed on the plant height and volume variables using a three-way analysis of variance (ANOVA). An analysis of variance was conducted to analyze the variation between means and this gave significant F values as indicated in Table 1and Table 2. The combinations of treatment in an ANOVA table would indicate any significant interaction between treatments. Following any significant effect as shown in the F value, a TukeyHSD test was conducted to highlight the significant differences between groups.
Statistical analysis was performed on the plant height and volume variables using a three-way analysis of variance (ANOVA). An analysis of variance was conducted to analyze the variation between means and this gave significant F values as indicated in Table 1and Table 2. The combinations of treatment in an ANOVA table would indicate any significant interaction between treatments. Following any significant effect as shown in the F value, a TukeyHSD test was conducted to highlight the significant differences between groups.
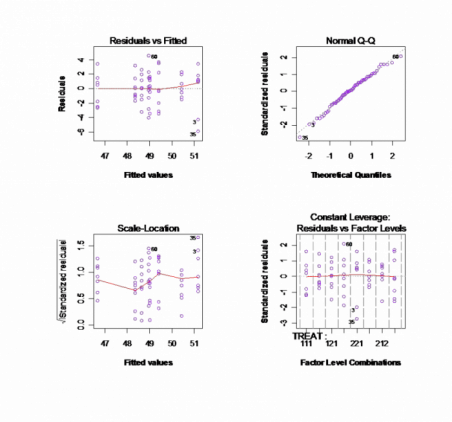
Figure 1: Residual plots of plant height.
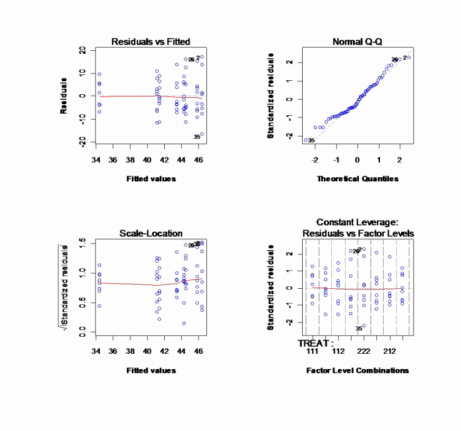
Figure 2: Residual plot of plant volume.
Table 1: Analysis of variance on plant height of both species
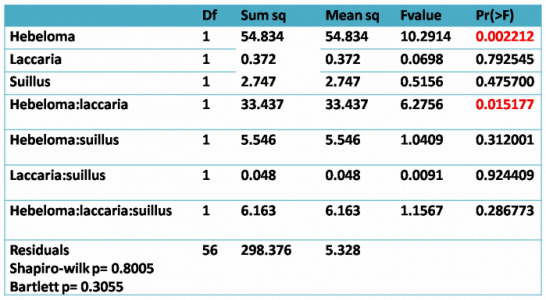
Table 2: Analysis variance on plant volume of both species
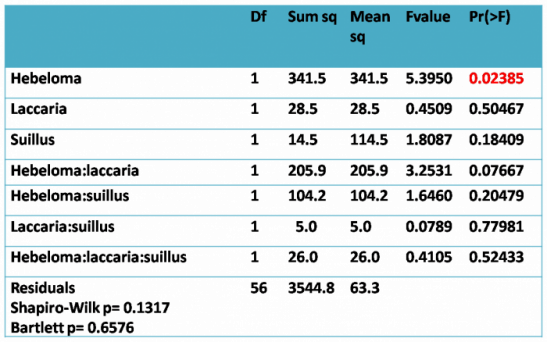
Significant effect of Hebeloma treatment and an interaction between Hebeloma –Laccaria was indicated in the plant height (Table 1). However, a significant effect was shown for Hebeloma only in Table 2. Although, there may be a chance of obtaining an effect of Hebeloma-Laccaria (0.07667) in plant volume as well if sampling time was extended (Table 2). This led to determining if there was a correlation between plant height and plant volume and consequently plotting an interaction plot to determine what kind of interaction existed.
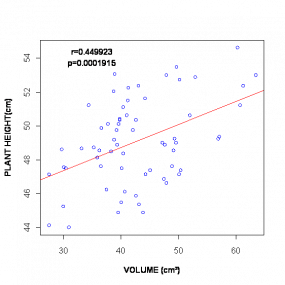 Figure 3: Relationship between plant height and plant volume. | 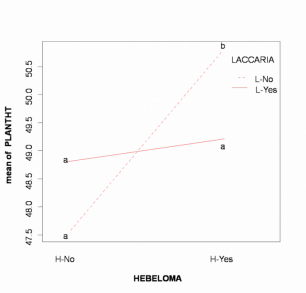 Figure 4: Interaction between significant group. Similar alphabets are not significantly different from each other. |
In figure 3, there was a significant relationship between the two variables but a weak correlation. This significant relationship could be accounted for given that plant height is a parameter used to measure plant volume. In figure 4, interaction between the Hebeloma and Laccaria was a negative one as either specie may have inhibited the growth of the other. However, it was best to infer that Laccaria was the inhibitory species since Hebeloma had higher plant growth in its absence. However, in the absence of both species plant height was very low.
Finally, plot volume index, which measures the extent of plant viability, was analyzed using a one-way ANOVA for the plant species. Means of all singly, double and triple inoculated treatments were pooled together, hence the difference in the number of observations. Significant effect of was observed from ANOVA p=0.0481 and 0.03474 for jack pine and white spruce respectively. This was followed by a TukeyHSD test to determine differences between groups of treatment. Data is summarized in Figure 3.
Finally, plot volume index, which measures the extent of plant viability, was analyzed using a one-way ANOVA for the plant species. Means of all singly, double and triple inoculated treatments were pooled together, hence the difference in the number of observations. Significant effect of was observed from ANOVA p=0.0481 and 0.03474 for jack pine and white spruce respectively. This was followed by a TukeyHSD test to determine differences between groups of treatment. Data is summarized in Figure 3.
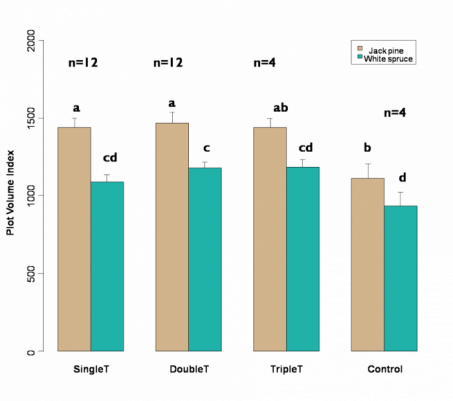
Figure 3: Bar graph showing the means of pooled treatment with different plant species. Similar alphabets are not significantly different from each other. n denotes number of oberservations applied in the statistic.
